Staffing Undergraduate labs
I argued a few years ago that it was worth reviewing whether the RSC’s lab hour requirement should change to recognise students’ need to hold down a job. A lot of people disagreed with me!
In the intervening years, I’ve been thinking a lot about how the shape of the UK HE Chemistry relates to that discussion. Small departments are closing as large ones expand, and total student numbers in Chemistry seem likely to decline as the country loses the bench space of the smaller Departments while hitting max capacity at the larger Departments. I think this is bad, but acknowledge that my proposal (fewer lab hours to let students take jobs) probably allows larger Departments to take more students.
There is another dimension, though, which I’ve been chewing over for the last year or so: the PGR lab demonstrator. Staffing labs at the levels demanded by most Chemistry degrees typically requires a high number of student demonstrators. But - anecdotally - finding enough demonstrators has proved challenging in lots of very different Universities. Part of this is probably the increase in the UKRI stipend, though I imagine that some of it is also about how the cultures of research groups changed during the pandemic.
But some of it must relate to the hard numbers of students, which is the focus of this blog. I’ve been considering whether it might be the case that the standard degree structure assumes Universities have large numbers of postgraduates to support undergraduate teaching
Data
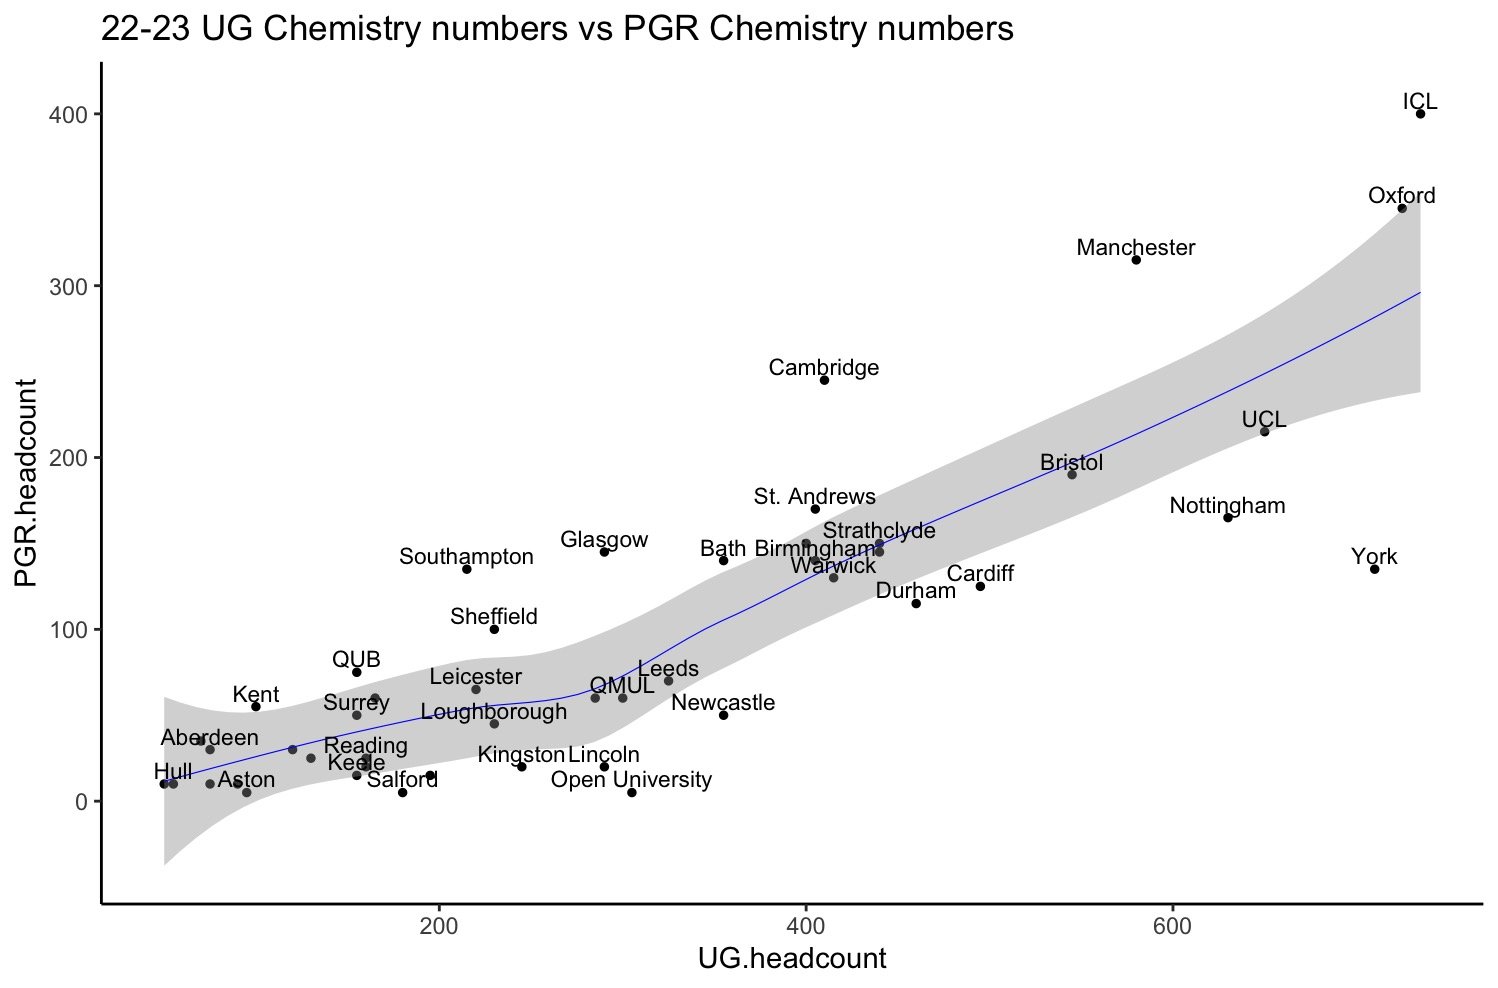
I took the public HESA data for 22-23 student numbers by Department and plotted them. A couple of caveats about the data are particularly relevant here: the numbers are hard to trust at very low numbers (as the reported numbers are rounded to end in either a 5 or a 0, which introduces a large % error at small values), and PGR students may include research masters’ students as well as PhD students.
The trendline R has plotted (with a bend in it) suggests that there might be two regimes: smaller departments (by undergraduate numbers) have proportionately fewer PGR students, but after reaching a critical point of UG numbers, PGR numbers increase at a much faster rate.
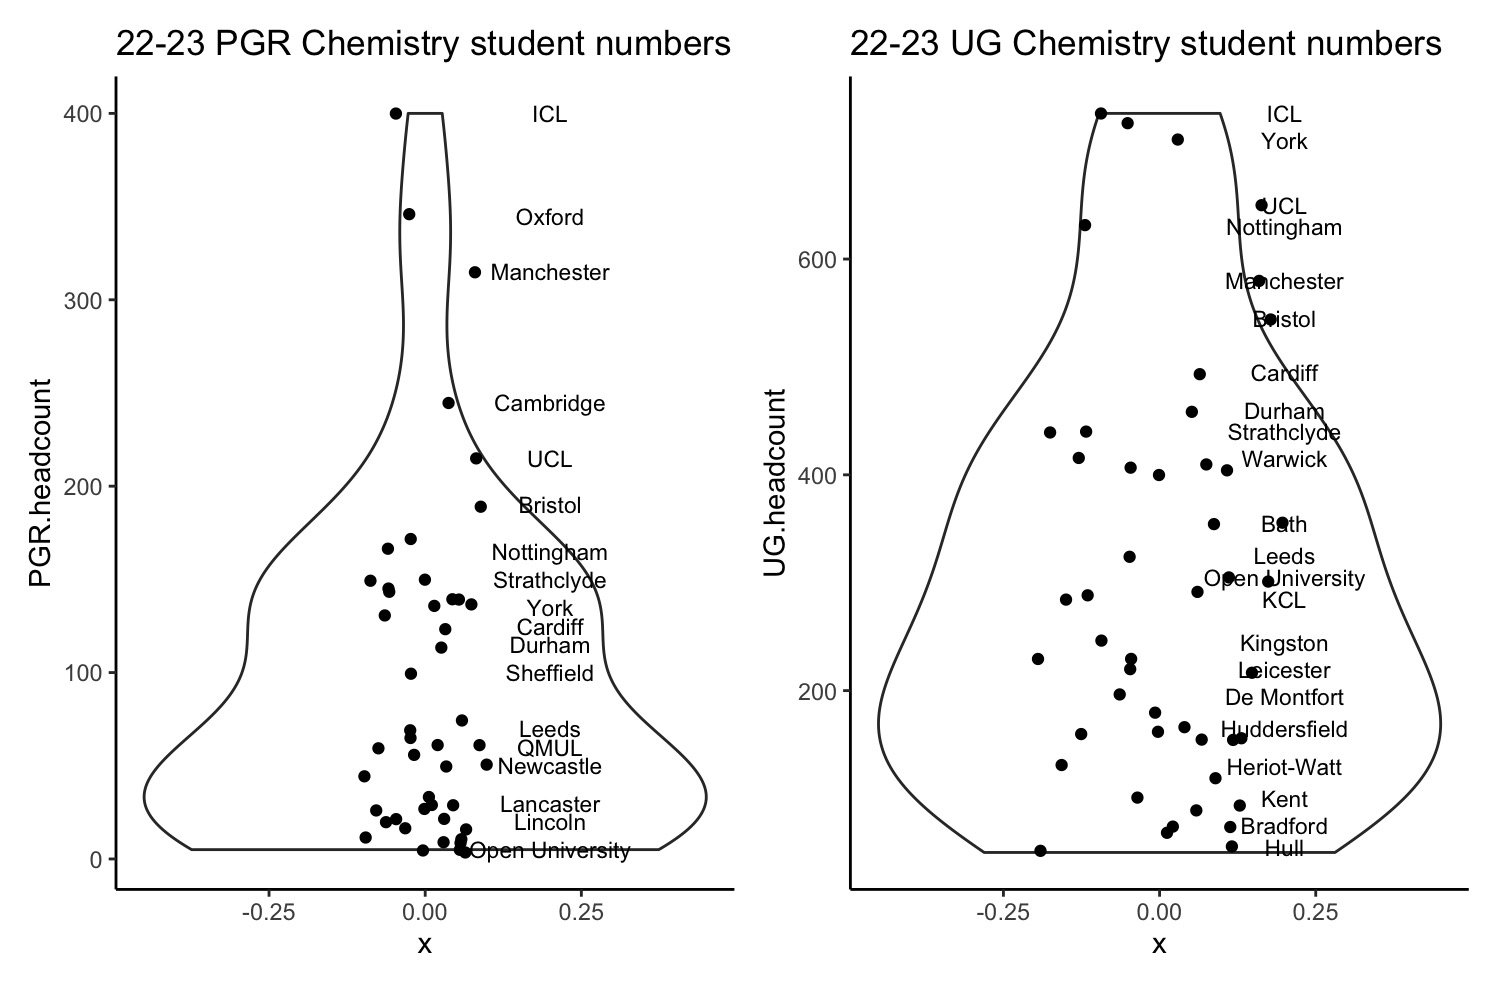
Im not sure how much I trust the trendline, but it’s interesting to consider whether recruiting student demonstrators plays out differently in different sizes of composition of institution. Violin plots of student numbers show that the pyramid is shallower for undergraduate numbers: there is a more pronounced concentration of PGR students in a few institutions than for UG students.
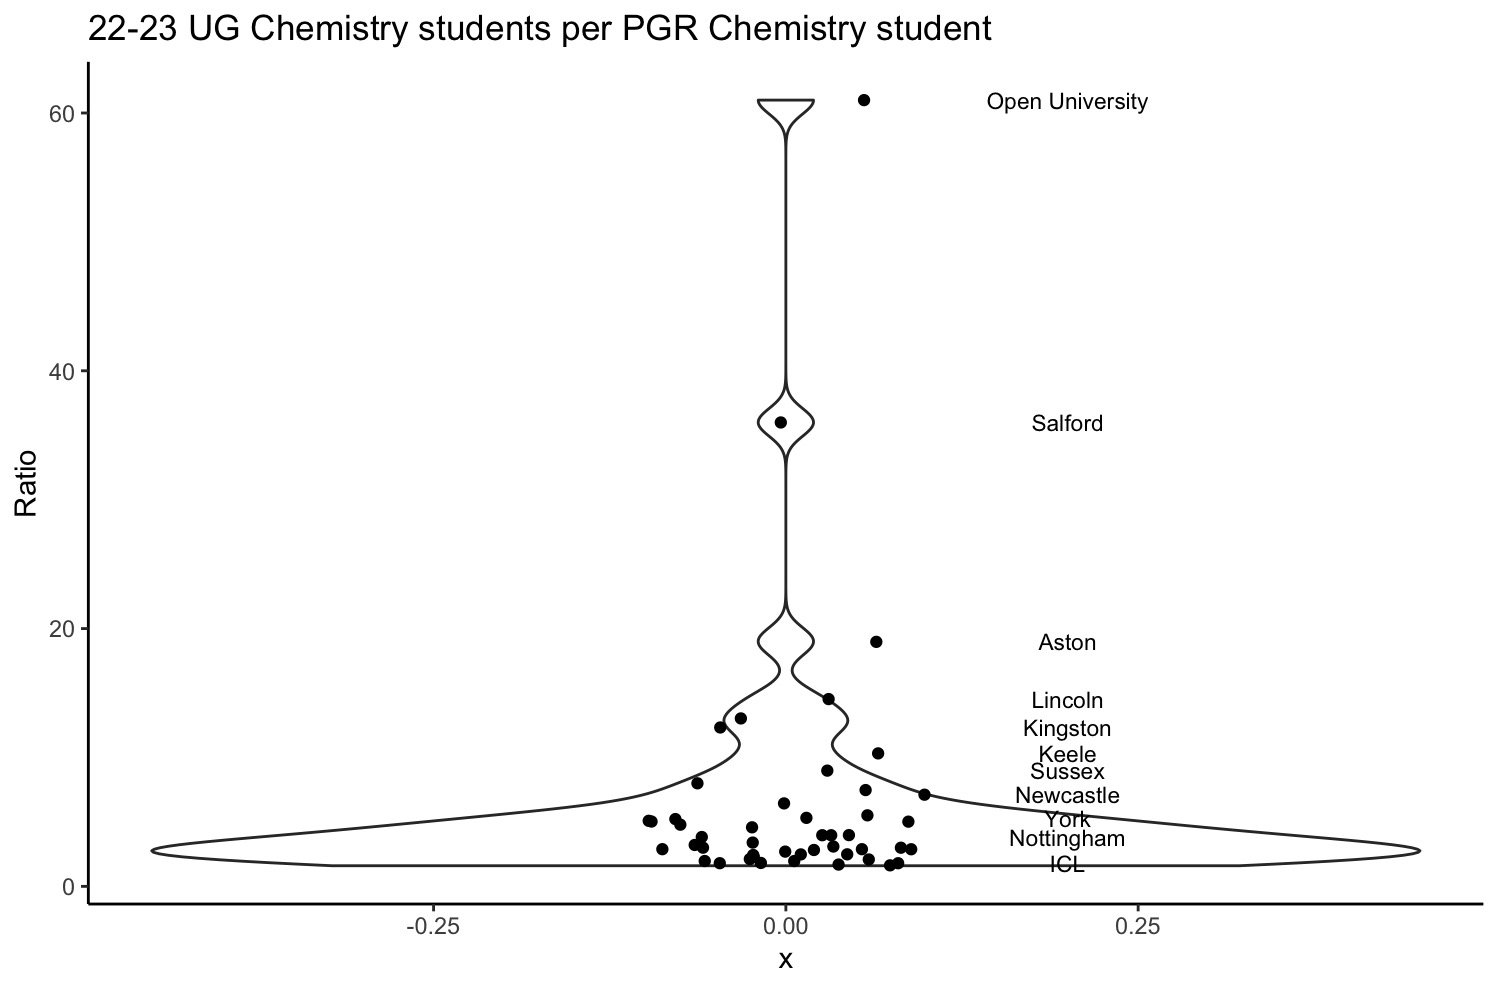
How does this differential affect the ratio? A violin plot of the number of UG students per PGR student in a Chemistry Department shows a couple of outliers. Despite the HESA numbers being hard to trust for small numbers, it is clear that the OU has an extraordinarily different ratio to other Universities. Their distinctive educational mission and model of residential lab courses are part of making this ratio successful.
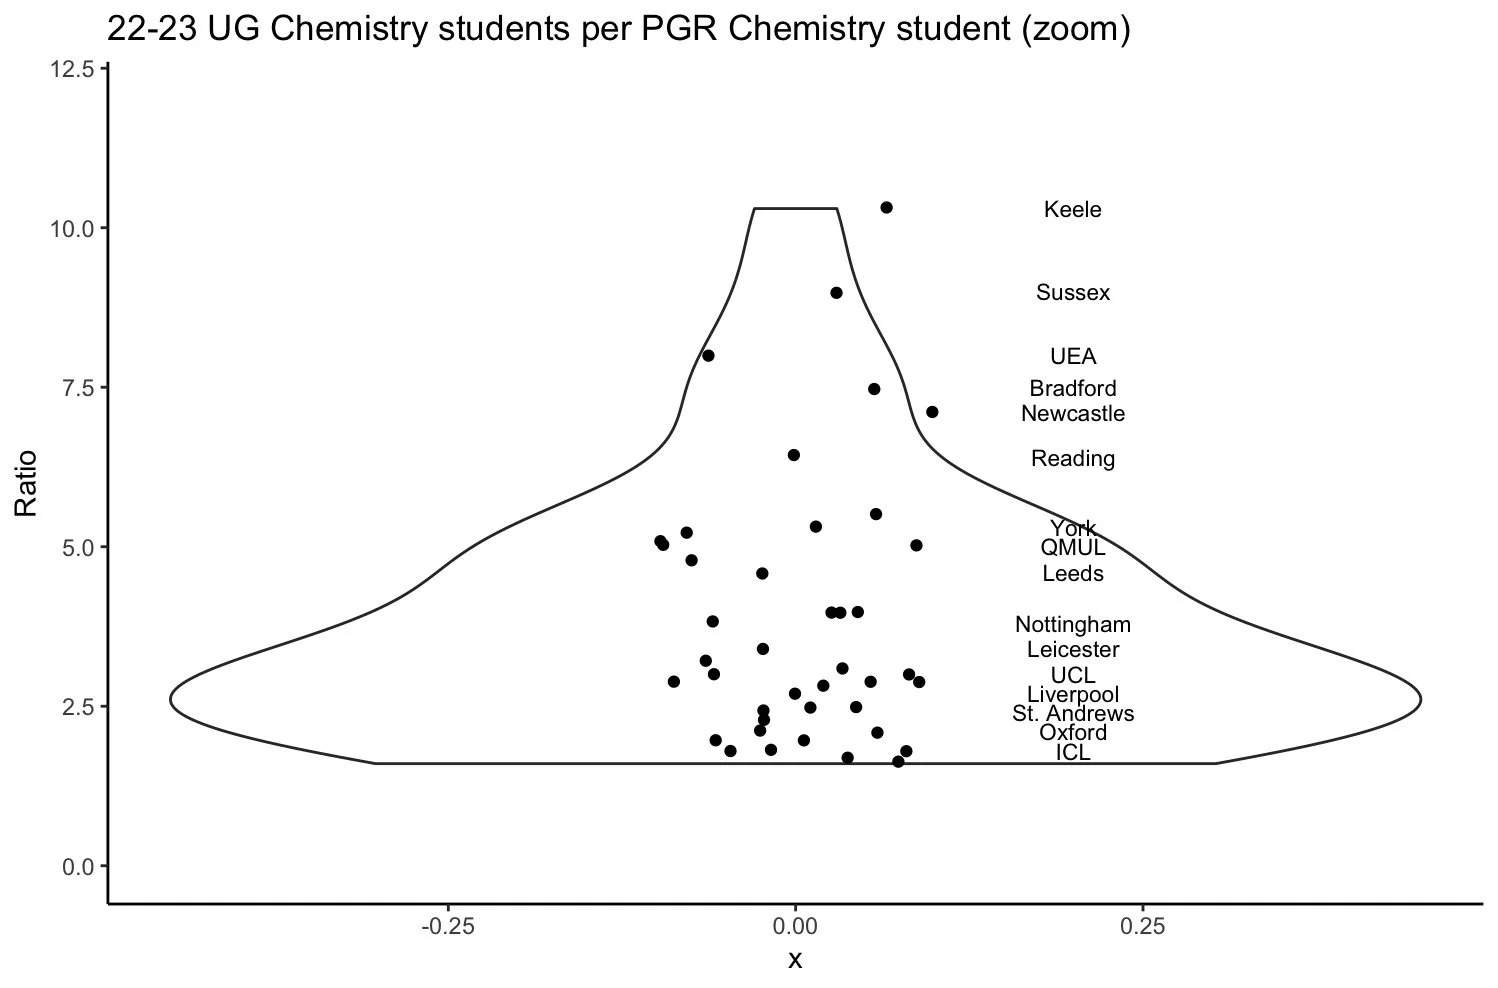
However there is a striking range of ratios even within the group of more traditional Departments. Staffing must look very different in places with 20 UG students per PGR than 5. The growing space for academic staff specialising in lab teaching is part of the picture which comparison of student numbers cannot capture, and there may be specific issues with pandemic extensions which mean that there are more students on the books than at the bench in the 22-23 year. Yet this range is still striking.
This plot is the same as the one above, but zoomed into the lower ratios.
I’m not sure there is a clean-cut conclusion I’m looking to draw here. I guess something I notice is that lab teaching staff normally exist in the bigger Universities, but it is also these same Universities which typically have more PGR students. The economies of scale available at high student numbers might be one part of this: it is probably prudent to professionalise lab teaching when running a large lab at full capacity.
But there is probably a thornier question in the background about whether the current expectation of hundreds of lab hours is sustainable as a general expectation across such a diverse sector. Approaches like the OU’s residential model only work because they are so thoughtfully designed and embedded into the wider curriculum. Switching to this model would incur massive costs in a time of low liquidity.
Code
I am learning to code in R, and am going to try and document my journey by giving code for the plots I produce in blogs.
Csv file (file curated manually from HESA public data)


