Student:Staff ratios in Oxford
I wrote a blog a few months ago about the student:staff ratios between different disciplines. I’ve used the same data set to look at the different SSRs within Oxford. I’m teaching a lot at the moment, so this post is mostly a presentation of the raw numbers rather than a deep analysis.
Whole University
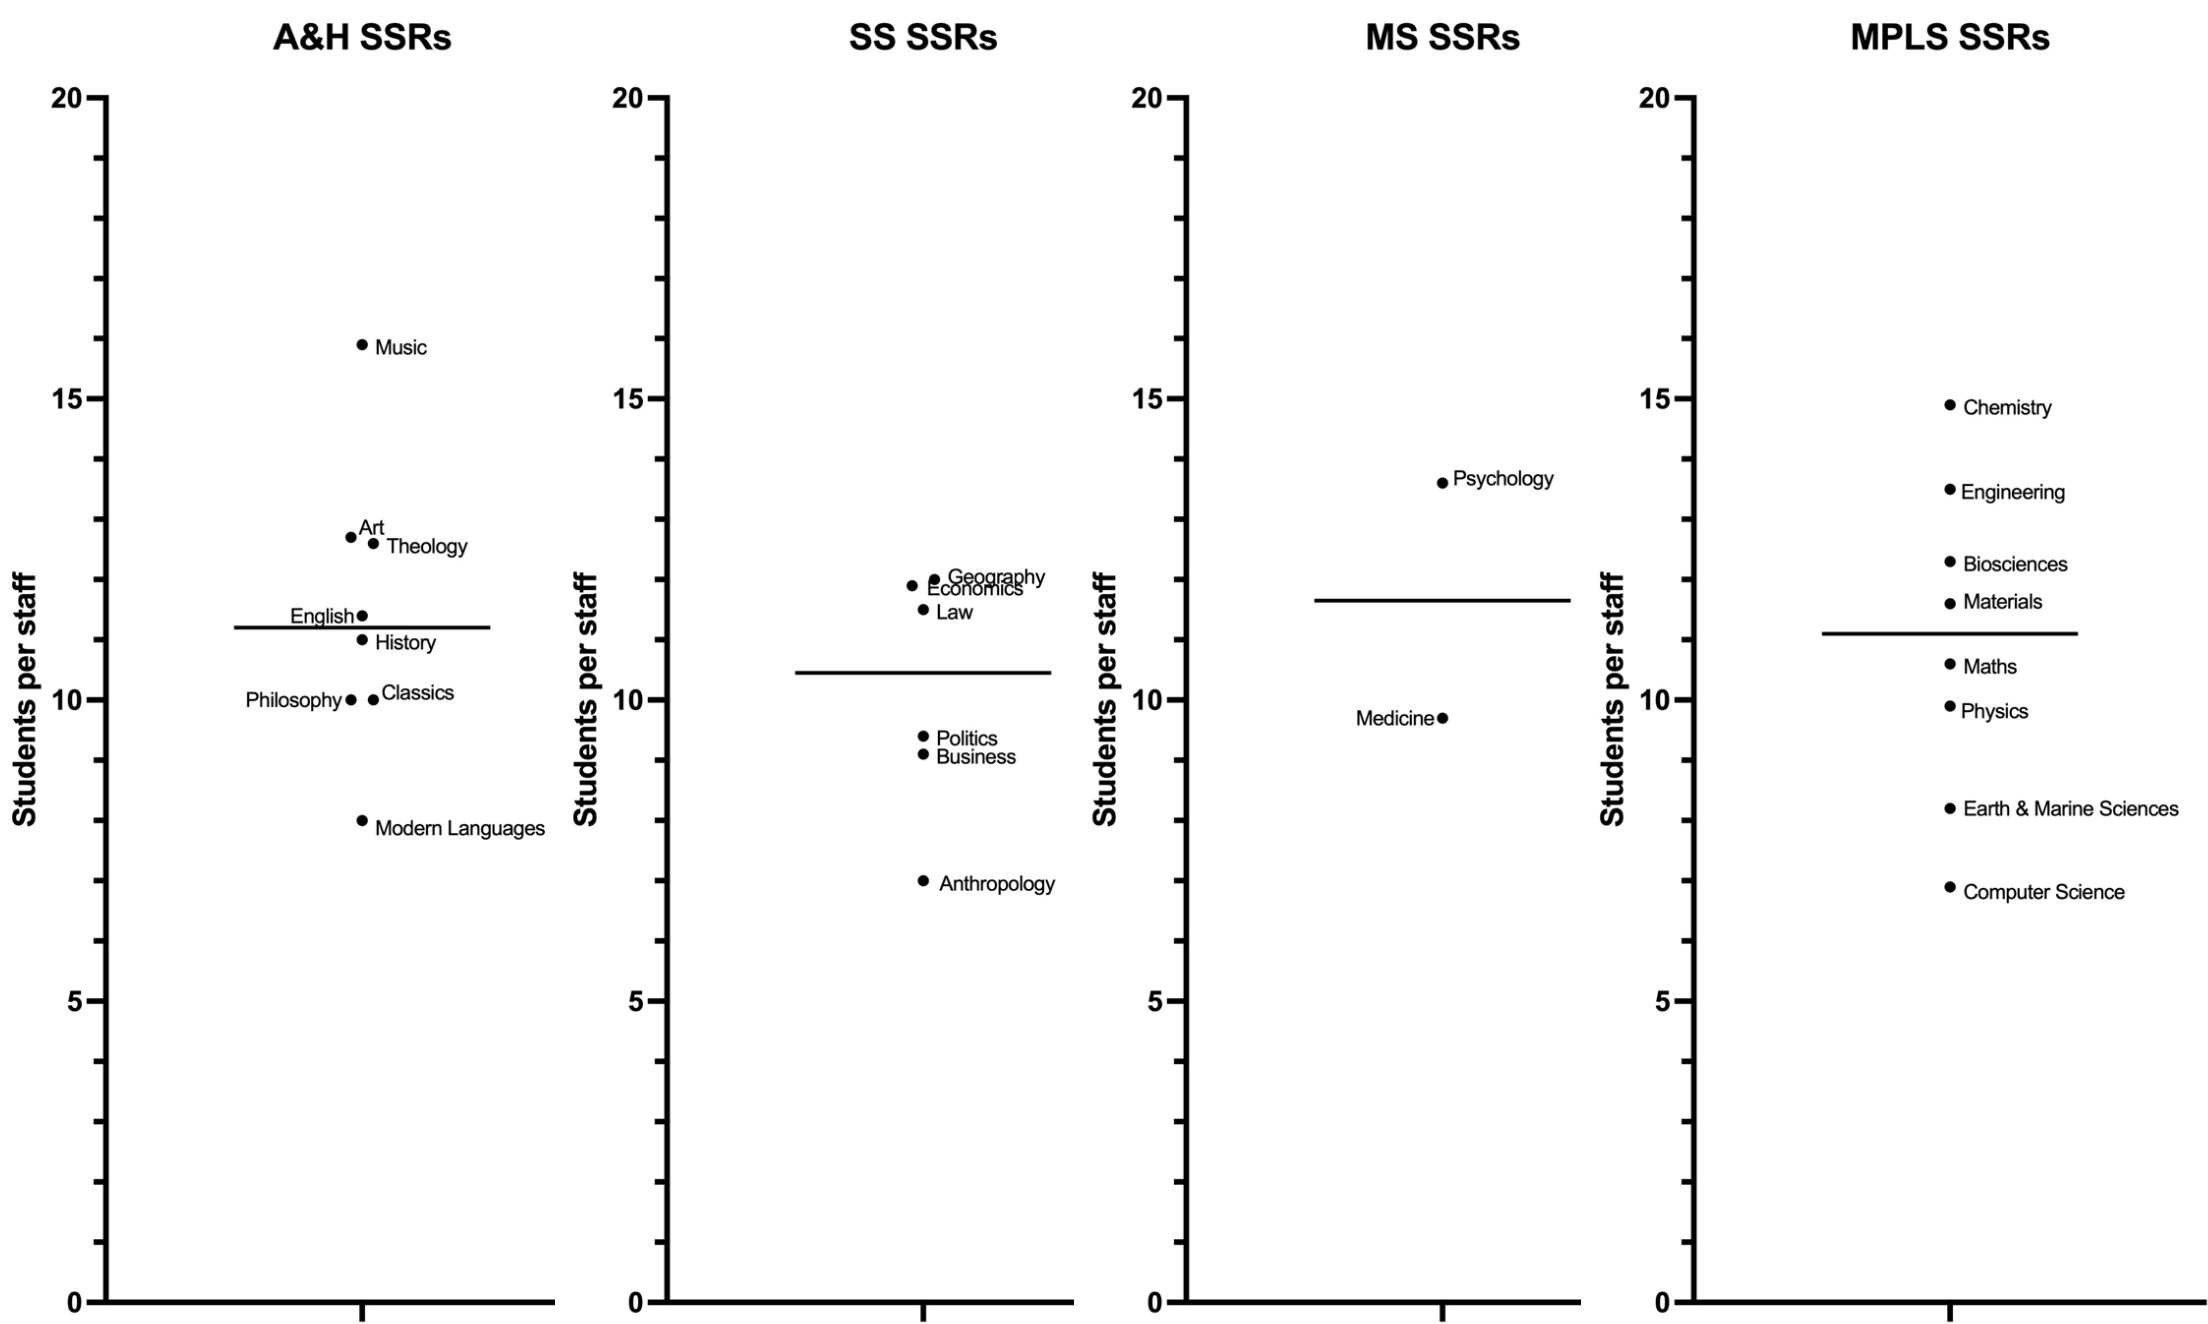
The SSRs vary widely. Computer Science has the most generous number of students per member of staff (6.9 students/staff) and Music the least generous (15.9 students/per staff). The median subject in the data has 11.2 students/staff, with upper and lower quartiles falling at 12.5 and 9.5 students/staff respectively.
Different subjects are often staffed differently, so seeing some variation in the numbers is expected. The distinction between UG and PG students may also contribute to some of the outlying values: my understanding is that the Guardian League table divides the number of undergraduate students by the number of academic staff. This might make departments with flourishing masters courses seem amply-staffed relative to departments with an undergraduate focus, for example.
It is also very unclear to me how college teaching is(n’t) captured by the HESA data the Guardian draws on. It might be that each department has a comparable reliance on college tutorial teaching, but it might also be that some subjects rely more/less heavily on Oxford’s signature pedagogy.
By Division
I have coded each Guardian League Table ‘subject’ into the Division which I think it sits best within: Mathematical, Physical, & Life Sciences (MPLS), Arts & Humanities (A&H), Social Sciences (SS), or Medical Sciences (MS). There will still be subject-level differences, but perhaps the comparison between similar(ish) subjects is more meaningful: it seems fairer to stack Chemistry alongside Physics than History.
Some of the subjects are ambiguous, and someone else might have made a different call about which faculty they sit within. For example, the Guardian subject ‘Biological sciences’ might sit within MPLS (with Zoology) or MDS (with Biochemistry). I’ve labelled each point so it’s transparent which decision I’ve made.
SSRs vs Contact Hours
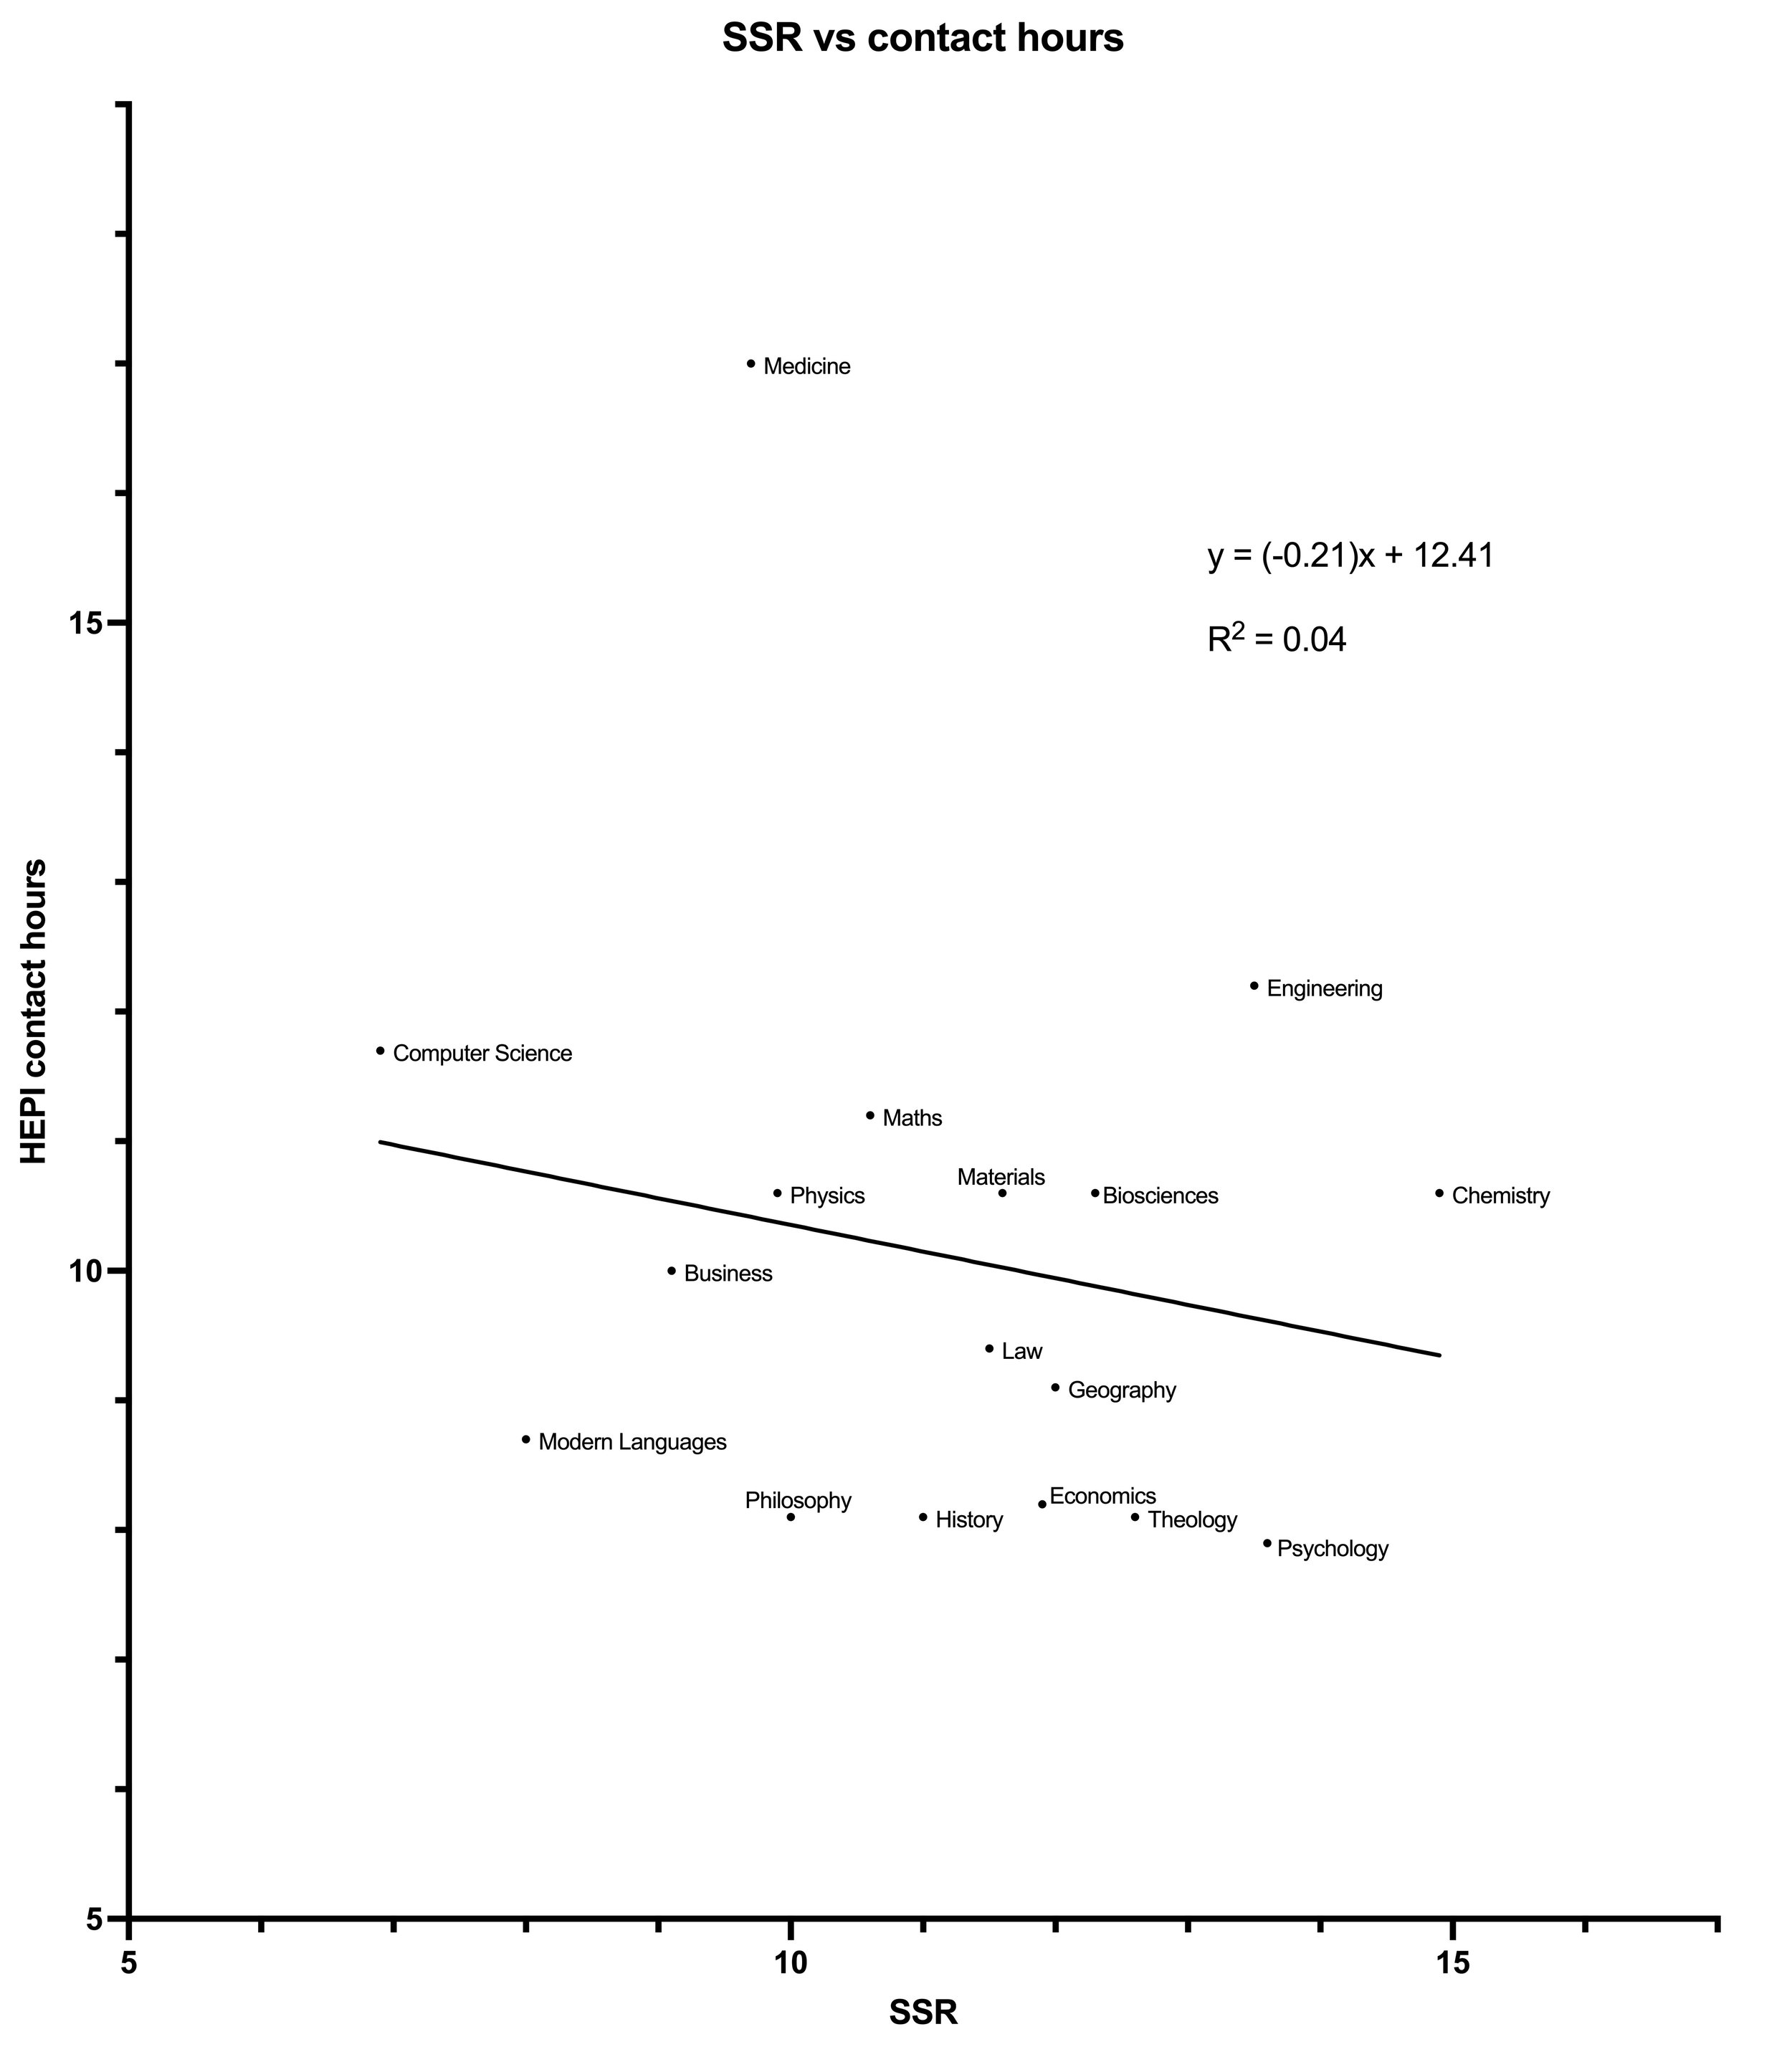
I’ve also plotted the HEPI-reported student contact hours for subjects against the SSR at Oxford.
Though there are obvious problems (Oxford might not teach in the same way as the national averages, and the descriptions of subjects nationally might not map onto exactly the same categories as the Guardian League Table data uses), this might be thought of as a crude way of understanding whether staffing levels relate to student contact hours. This is a much weaker analysis than the one-variable SSR plots above, and bluntly will not sustain too much weight.
The graph has a flat line of best fit, with an R2 value suggesting that there is no meaningful correlation between the HEPI national contact hours and Oxford’s SSRs.
Pulling apart the subjects by division (again, this is messy because the mapping between Guardian and HEPI data sets is imperfect, especially because so much of the MPLS data gets lumped under ‘Physical Sciences’ in the HEPI survey), it is striking that all the gradients are negative; are subjects with less contact time staffed more generously? We probably can’t say that based on this data, but it’s interesting to think about whether the lines would slope upwards in an ideal world.
Conclusion and Reflection
A naive view of teaching management might be ‘if you teach more, you need more staff’, but perhaps that’s not true.
Maybe pedagogies change at certain staffing thresholds, or maybe staffing levels are more of a political artefact than a logistical one. It is also possible that staffing levels might be measuring research intensity rather than (or perhaps combined with?) teaching intensity. Maybe student:staff ratios are simply irrelevant to teaching.
But even on the basis of the variation in one-dimensional SSRs we can ask some really fun questions about ambition and intention. What would it look like if Chemistry were staffed like Computer Science? If Music were staffed like Modern Languages? If Psychology were staffed like Medicine? What kinds of teaching would become possible? What sorts of student outcomes would become realistic? What kind of Widening Participation initiatives would become successful? What types of inclusive assessment could be trialled and refined? Where is there space to develop new types of curriculum, and where is there structural pressure to cling to the status quo?
SSRs sit in between what current HE is and what future HE could be. It’s worth thinking about how the numbers should and do vary between disciplines. It’s worth speculating a little to see whether pushing SSRs up (or - in principle - down) would dramatically change what we have at the moment.


